| Generally, anyone who is moving lower in RF score is in the process of defecting - of leaving you as a customer.
The more dramatic the move, the more likely they are to be defecting. The mirror image is true for those climbing in score. The more dramatic the move, the more likely it is they are on their way to becoming a more valuable customer and adding value. As I said earlier in the book:
The customer lifecycle for interactive businesses is more exaggerated than for traditional Data-Driven businesses. The behavior ramps up faster at the beginning of the cycle, but then falls off faster into the end of the
cycle.
The speed or rate of behavior change is incredibly important to modeling interactive behavior, much more important than in offline models. Small changes over time are to be expected; rapid and accelerating changes are much more significant and signal a time for action.
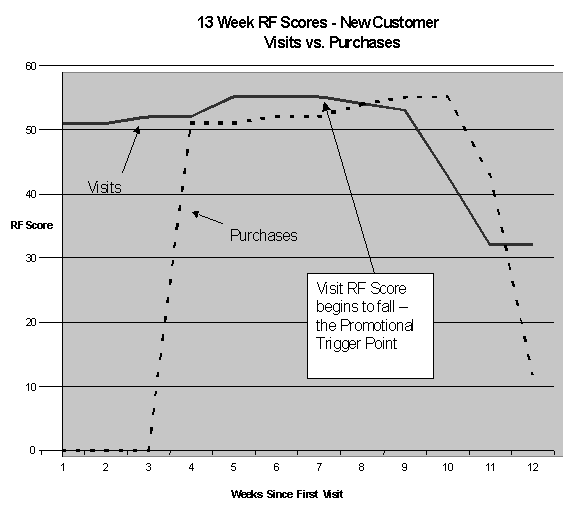
For example, check out the above graph of new customer behavior over the first 13 weeks of being a customer.
RF scores for visits and purchases are on the y-axis (left side); the number of weeks since the customer made a first visit are on the x-axis (along the bottom). First day of contact is at the far left. Just look at it for a second. What does the data speak to you? If you saw this chart, could you instantly form a new customer marketing plan, particularly if the average new customer behaved in the same way?
You would certainly have a good idea of WHEN to do the promotion Ė itís when the visits start to fall. If you can keep them interested in visiting the site, perhaps the purchase behavior wonít fall off as quickly.
In this chart, the customer starts off at RF 51 on visits, as all new customers would, with zero purchases. Then the visit RF score starts to rise, and in the 4th week, the first purchase is made (RF 51 on purchases). The visits peak in weeks 5 through 7 at RF 55, then start to fall off. Purchasing peaks 3 weeks after visits do, in week 10, then falls off a cliff, ending with the RF for purchases even lower than the RF for visits. So you basically have 3 weeks in there somewhere to try to grab onto this customer before the lightning-quick defection takes place.
The first time you see this kind of data on your own customers, if you donít get a rush across your entire body, you need to be in a different line of work!
You don't have to look at single customers; you can use
segments of customers with common origins or habits. But
with the level of automation available, it is conceivable RF
scoring over time could be used to automate individualized
retention campaigns. Changes in RF scores become "Trip
Wires" that activate campaign elements.
The marketing implications of this behavior are staggering. Can I get them to start purchasing a little earlier, when I see the visits ramping? Once I see the visits beginning to drop, can I extend the purchase cycle? What type of promotion would be effective to do either of these? You have to test your ideas and find out. But at least you now know a critical piece of information Ė WHEN to pull the trigger. The data will speak to you.
What weíre talking about here is called the LifeCycle of a customer. RF scores over time. Every customer has a LifeCycle, and becoming familiar with the different types of customers you have and their LifeCycles is one of the most powerful marketing tools you can have at your disposal. Think of it. How powerful could your marketing be if had an idea of what your customers were going to do before they did it?
The fact is, you can have this knowledge. LifeCycle analysis works. Itís about human behavior. A new product
/ service excites people and then they get tired of it. They binge and
get exhausted. It has a lot to do with where they are in their lives and whatís happening around them.
- From Chapter 9 of the book:
Drilling Down: Turning Customer Data into Profits with a
Spreadsheet
 The
Drilling Down Project All Rights Reserved The
Drilling Down Project All Rights Reserved
|


![]()
